


In Europe, the amount of plastics wastes produced amounts to about 25 million tonnes a year. On the average, no less than 37 kg plastic waste a year will be produced by each German, this amount being based on nothing else but packaging waste [1]. Quite often these plastics will end up as micro-plastics in the air, in the soil and in the sea and thus in our foodstuffs. To counteract this adverse impact on our environment and our health, the European Union aims at circular economy [2] in order to preserve resources as long as possible.
The future energy goals of the European Union are defined
One step on this way is that of minimising one-way (disposable) plastics: All plastic packaging on the EU market is to be recyclable by 2030 [3].
The future energy goals of the European Union are defined as follows: a share of at least 27% in renewable energies and an increase of energy efficiency by at least 27% by 2030 [4]. In order to achieve these goals, however, it will be necessary to increase the demand for secondary raw materials and the use of high-grade recycled materials.
On the global recycling market, China’s National Sword Policy must not be underestimated either. This policy comes up with laws about the import of waste to China that are becoming more and more stringent and additionally exerts pressure on recycling industry.
Thus, recycling as well as secondary use of waste as fuels or as packaging materials is one of the most complex and most important topics of our time.
If, for example, it is all about the high life cycle of high-quality final products made of plastics, ensuring purity of fractions in terms of their chemical composition as well as sorting of different plastics (PET (polyethylene terephthalate), HDPE (high-density polyethylene), LDPE (low-density polyethylene), PP (polypropylene), PVC (polyvinyl chloride), PS (polystyrene), POM (polyoxymethylene), PA (polyamide), etc., according to colours are relevant factors.
This will often be difficult. For as the different polymers insufficiently differ in their colour, density and electrical properties, it will not be really possible only to separate them by using a colour camera, density sorting or by means of electrostatic sorting.
Hyperspectral camera systems (HSI – hyperspectral imaging) in the wavelength range of 900-1700 nm offer an ideal substitute or supplement to colour cameras. For as their wavelength range is beyond the visible light, i.e. in the infrared range, they make it possible to detect the chemical composition of different polymers without having to consider the effects of the visible colour.
Due to the enormous opportunities yielded by this technology, EVK has offered know-how in the fields of plastic sorting and quality assurance for many years and delivers solutions ranging from data acquisition to decision-making.
In this respect, EVK Hyperspectral Imaging Systems work according to the so-called push-broom principle. This means that recording will be done line by line and an image in the traditional sense of the term will not be created until the velocity of motion of the object is coupled with line acquisition of the sensor. This helps to generate images that do not only have a local resolution of 320 pixels but also a spectral resolution of 258 wavelengths. It is true that this spectral resolution is quite high and leads to a big data volume. Nevertheless, the use of a line camera with an integrated real-time evaluation makes it possible to achieve a full-frame rate of up to 500 Hz or, at a reduction of the spectral range, even to reach frequencies of more than 1 kHz. Thanks to the combination of the high frame rates with the wavelength range used, it is possible to detect miniature objects, such as plastic flakes, and to classify them depending on their material.
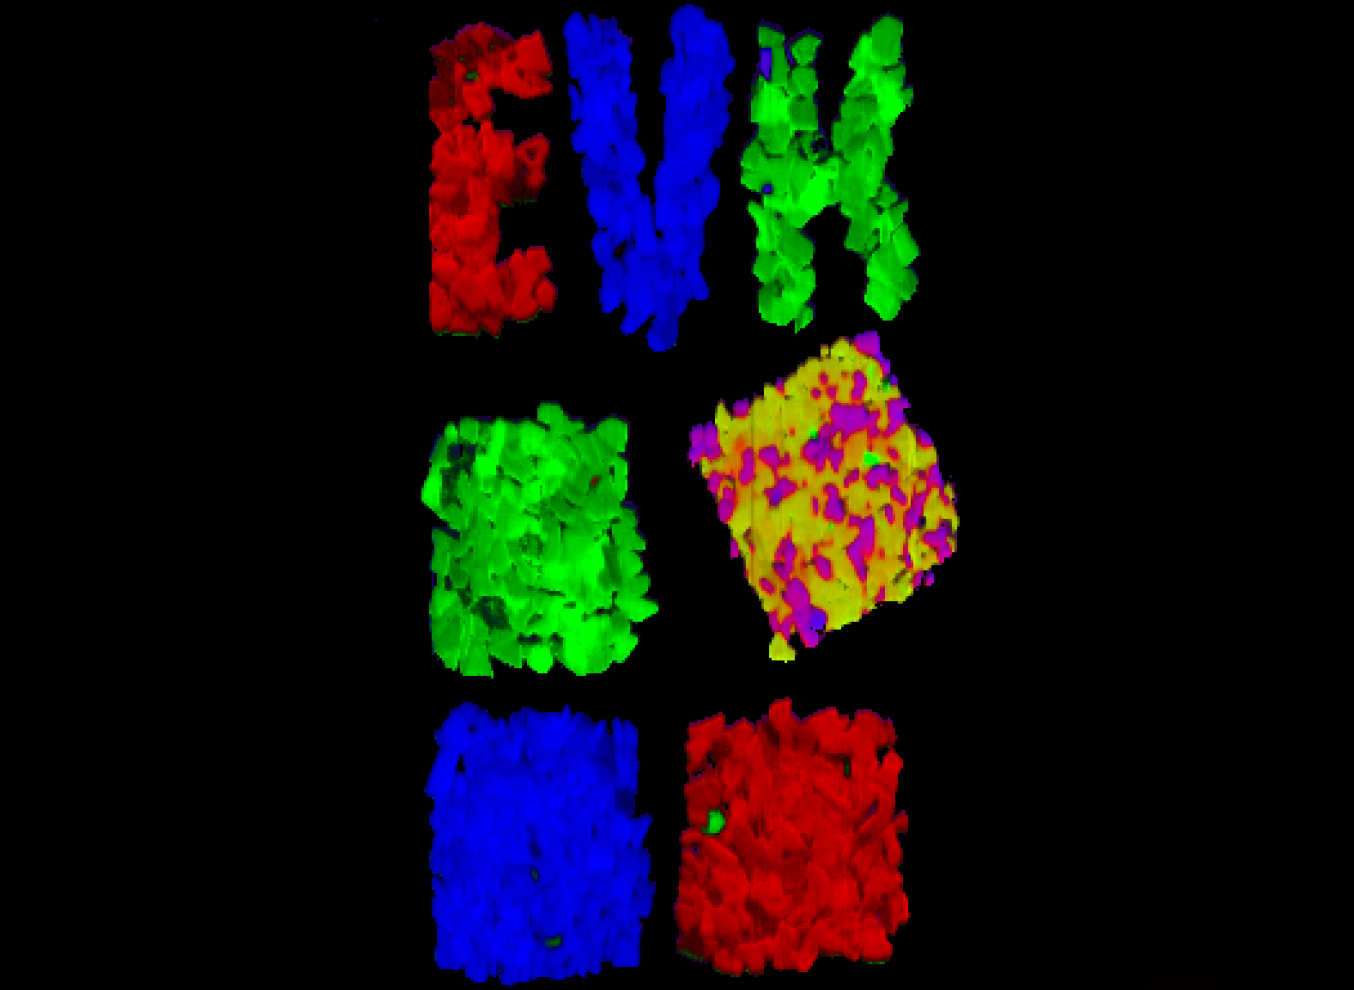
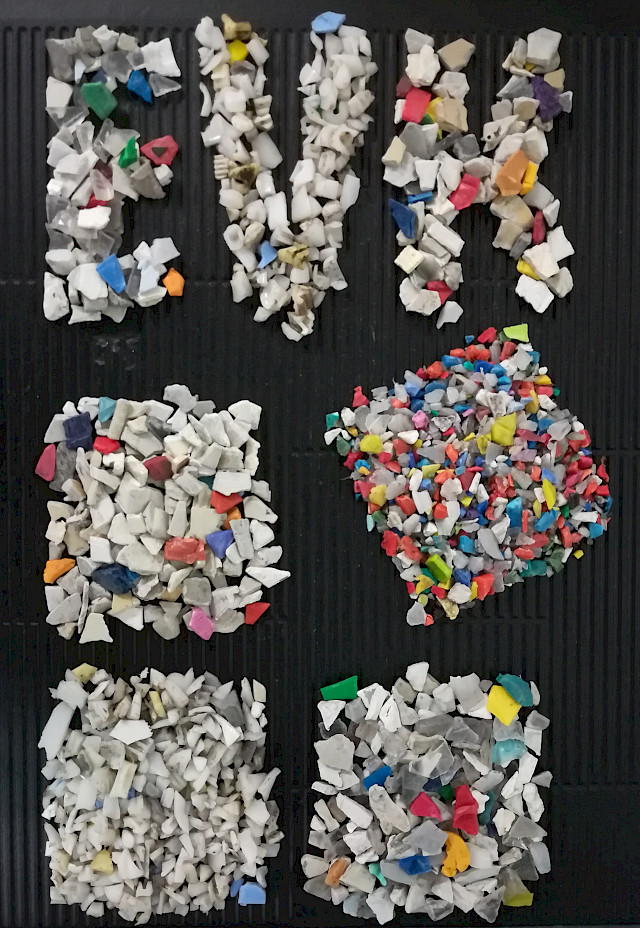
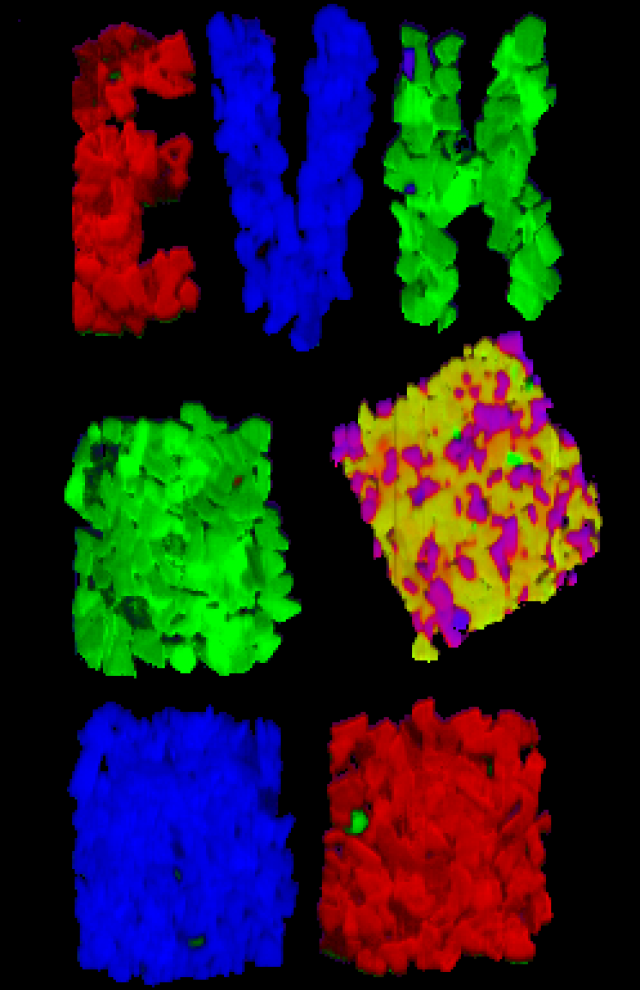
In this respect, different algorithms are available. These algorithms enable to visualise classified materials in an RGB (Red Green Blue) false-colour image as it is shown in Figure 1. Such an image as it is shown on the right side of Figure 1 is identically reproduced in the classified stream of the camera and makes it easy to detect individual foreign materials and impurities.
Quantitative measurement of the net calorific value (NCV) of the bulk material
Still another example from industry shows the problems with reuse of secondary fuels.
Out of 8.3 billion tonnes from annual plastic production in 2015, only 600 million tonnes were recycled, 800 million tonnes being burnt (Ref. [1]). Therefore, reuse of plastic waste as secondary fuels is a contribution to a sustainable recycling policy in terms of environmental and economic policies. Thanks to the analysis of the materials to be burnt, it will be possible to determine in advance how much material needs to be fed to the incineration process in order to achieve a stable process.
This will enable good housekeeping with recoverable fuels and thus help to save the environment while increasing the economic efficiency of garbage incineration plants.
In concrete terms, this means that the use of a quantitative hyperspectral analysis directly in-line can help to improve economic efficiency of the line.
For this purpose, EVK has developed the analysis tool SQALAR and thus a solution that can be used for quantitative real-time monitoring of material streams based on data analysis. Thanks to so-called “Quantitative Chemical Imaging” (QCI), relevant measuring variables will be acquired right in the line so that it will, if necessary, be possible to intervene in the ongoing process and change it in case of need. The reflection spectrum of the material used in this process will change proportionately to the occurrence of functional groups within the material.
In this respect, the big advantage is that it will be possible to identify a representative measuring value of such important process variables as humidity and the net and gross calorific values throughout the material stream in real time.
Such an analysis of the overall stream will make it possible to make process control even more accurate and to assess different suppliers as well as the material qualities delivered by them.
In order to enable such a quantitative analysis using HSI (hyperspectral imaging), it will, first of all, be necessary to record several hyperspectral images of the product stream. Then specimens will be taken out of this material in a well-aimed manner and studied by means of methods based on reference analytics. Then the resulting reference values will be correlated to the fitting spectrums by means of multivariate data analysis.
This will help to create a model that can be used to predict measuring values by using spectral data.
Thus HSI (Hyperspectral Imaging) camera systems can, with the right know-how, be used to monitor the production of clinkers in cement plants. In this process, secondary fuels will be used to fire kilns. If the net calorific value of these secondary fuels is too low, there will be a critical drop in temperature: Therefore, the quality of the clinker will be reduced.
Up to now, specimens of these secondary fuels have only been studied by way of sampling and laboratory analysis. Yet as the material stream is so heterogeneous, and the amounts of specimens are too low, this does not lead to expressive results. Moreover, it should be borne in mind that such laboratory measurements cannot be done in real time and therefore highly depend on local fluctuations.
For such a quantitative analysis based on HSI (hyperspectral imaging), several specimens out of the product stream will first be recorded and studied by way of reference analytics. Therefore, the measurement won’t be subject to any fluctuation due to insufficient sampling and re-adjustment can be done without delay.
For such a quantitative analysis based on HSI, several samples are initially taken from the product stream and analyzed by reference analysis.
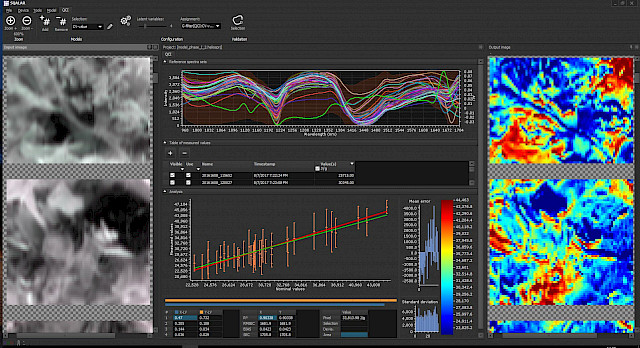
Then the spectral image data will be evaluated by using SQALAR. The result of such a quantitative measurement of the net calorific value can be seen in Figure 2. The correlation function of the reference values with the spectral data, which is shown here, as well as the resulting feature curve will be used to determine the net calorific value. In the camera stream subjected to final classification, the initial image data will be scaled on the basis of the measuring variables and shown in false colours. This enables quantification of the process variables.
Thus, concrete application know-how of correct data processing and smart information management helps to turn the Hyperspectral Imaging Technology into a measurement, monitoring and sorting system helping to improve the Return on Investment within a facility sustainably.
Sources:
[1] Schüler, K.,
Aufkommen und Verwertung von Verpackungsabfällen in Deutschland
im Jahr 2015, Umweltbundesamt, Dessau-Roßlau 2017, https://www.umweltbundesamt.de/sites/default/files/medien/1410/publikationen/2017-11-29_texte_106-2017_verpackungsabfaelle-2015.pdf
[3] European Commission, 2030 Climate & Energy Framework, Brussels 2014, http://europa.eu/rapid/press-release_IP-14-54_en.htm
[2] Europäische Kommission, Den Kreislauf schließen – Ein Aktionsplan der EU für die
Kreislaufwirtschaft, Brüssel 2015,
https://eur-lex.europa.eu/legal-content/DE/TXT/HTML/?uri=CELEX:52015DC0614&from=EN
[4] Europäische Kommission, Kunststoffabfälle: eine europäische Strategie zum Schutz
unseres Planeten und unserer Bürger und zur Stärkung unserer Industrie,
Straßburg 2018, https://www.ara.at/fileadmin/user_upload/Downloads/EU_Kreislaufwirtschaftspaket/EU_Kunststoffstrategie.pdf